
Fig. 2.
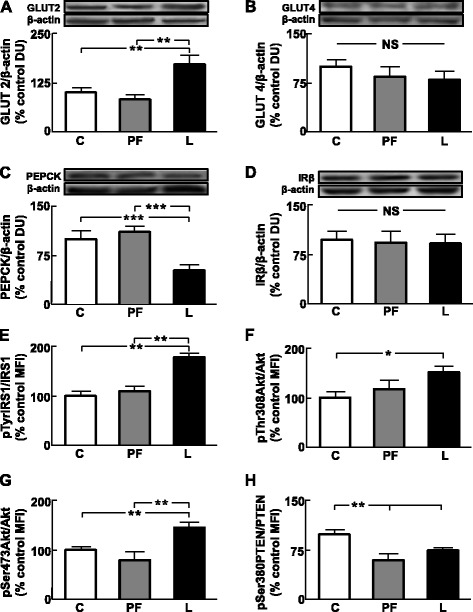
Leptin infusion modifies insulin signaling and parameters related to glucose metabolism in the liver. a. Relative glucose transporter (GLUT)2 protein levels. C, control rats; PF, pair-fed rats and L, rats treated with chronic icv leptin infusion. b. Relative GLUT4 protein levels. c. Relative phosphoenolpyruvate carboxykinase (PEPCK) protein levels. d. Relative insulin receptor beta chain (IRβ) protein levels. e. Relative phosphorylated (p) insulin receptor substrate (IRS)1 protein levels. f. Relative pAkt on threonine 308 (pThr308Akt) protein levels. g. Relative pAkt on serine 473 (pSer473Akt) protein levels. h. Relative p-phosphatase and tensin homolog on chromosome 10 (PTEN) on serine 380 (pSer380PTEN) protein levels. DU, densitometry units; MFI, median fluorescent intensity; NS, non-significant; *p < 0.05, **p < 0.01, ***p < 0.001