
Fig. 3.
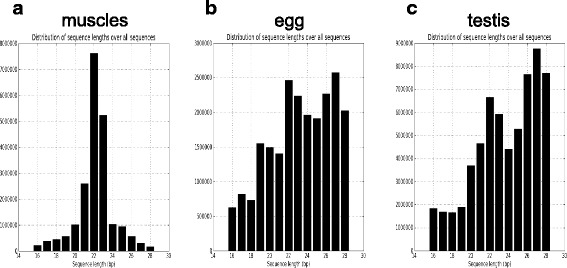
sRNA-seq reads length repartition. a The graph represents the read length repartition in a muscle sample (that is representative of all samples except gonadal tissue). b The graph represents the read length repartition in the egg sample. c The graph represents the read length repartition in the testis stage I sample. All the profiles are represented in Additional file 3