
Fig. 5.
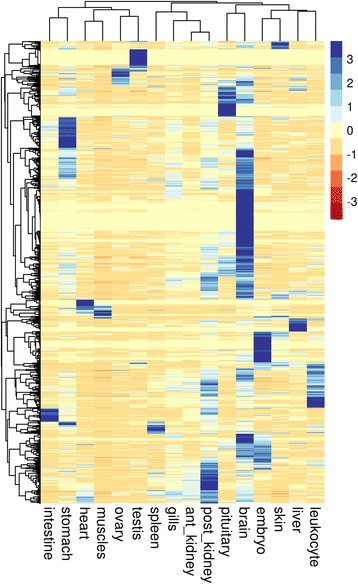
miRNA expression in the 16 tissues. Unsupervised average linkage clustering analysis of miRNA isoforms in rainbow trout tissue. Each row represents a miRNA isoform (total of 1946 rows) and each column a tissue RNA sample. Data were median-centered prior to the clustering analysis. For each miRNA, the expression level within samples is indicated using a color density scale