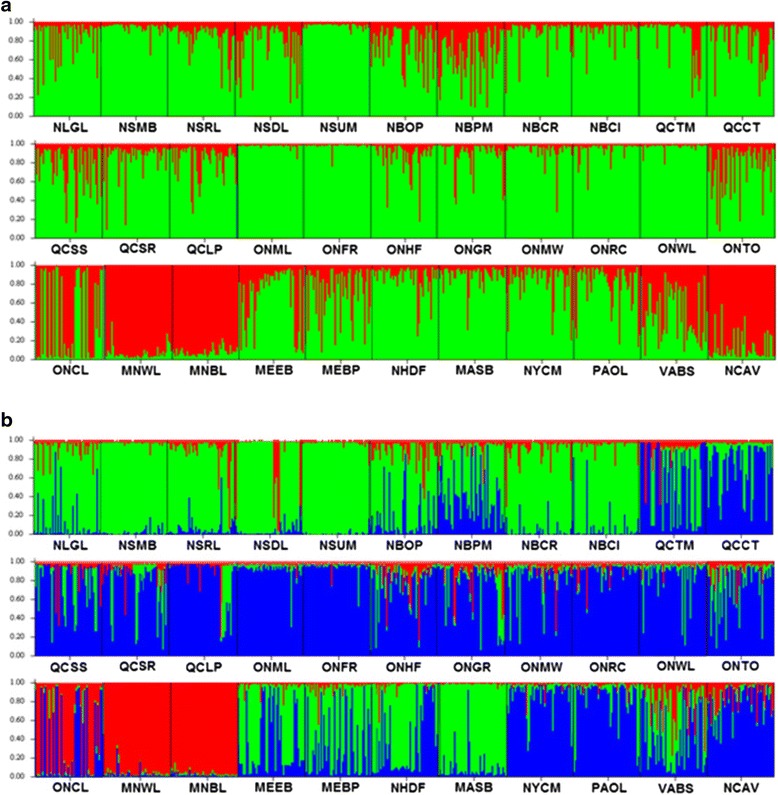
Fig. 3.

Summary bar plot of estimated membership coefficient (Q) of eastern white pine individuals from 33 populations from STRUCTURE analysis. Each individual is represented by a single vertical line. a K = 2: populations were clustered into a western (red) and a central/eastern (green) group. b K = 3: populations were clustered into a western (red), a central (blue) and an eastern (green) group, representing the three major phylogeographic lineages. The full names of the populations are provided in Table 1
