
Fig. 5.
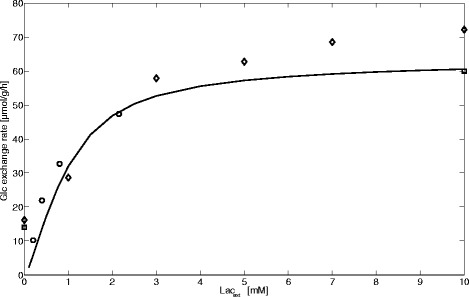
Gluconeogenesis from lactate. The solid line depicts the simulated stationary hepatic glucose exchange flux for fasted hepatocytes as function of the external lactate concentration (Lacext), which was varied between 0–10 mM. Data points represent experimental data taken from [39–41] with different shapes for each experiment