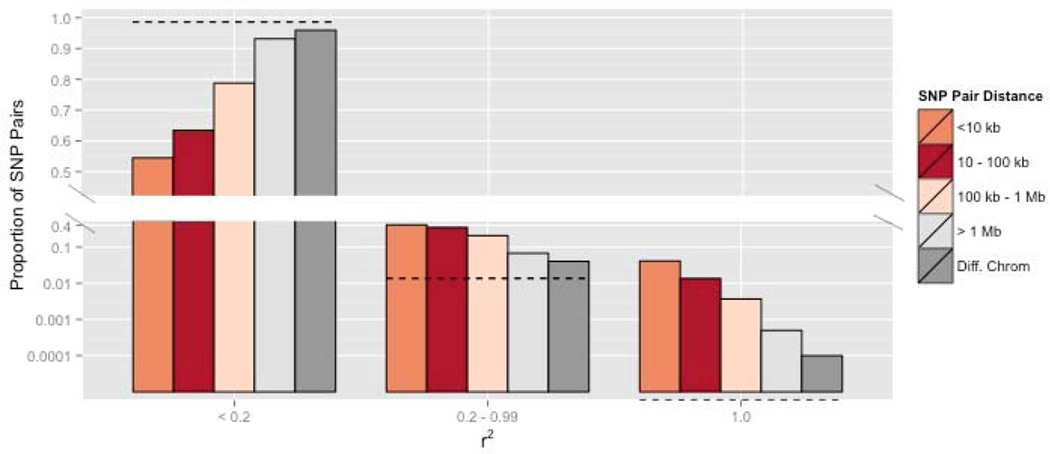
Figure 3.
The frequency distribution for r2 between SNPs within chromosomes is presented for Quarry parents. Here, we limit contrasts to SNP pairs separated by at least 1000 bp. The dotted line is the expected proportion of r2 estimates in the specified range for sites in linkage equilibrium (established by permutation). The dotted line is set at 0.0 for r2 = 1 because it was never observed in the permutated data.

