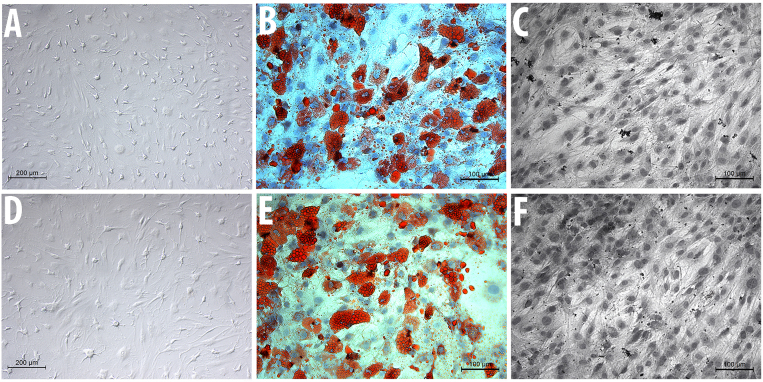
Figure 1.
Microscopic analysis of (A) MSC-control and (D) MSC-Sal. The differentiation of (B) MSC-control and (E) MSCSal into adipocytes is illustrated with Oil Red O staining, and shows the intracellular lipid droplets. The differentiation of (C) MSC-control and (F) MSC-Sal into osteocytes was measured by van Kossa staining and characterizes mineralization by marking the mineral components. MSC, mesenchymal stem cells.

