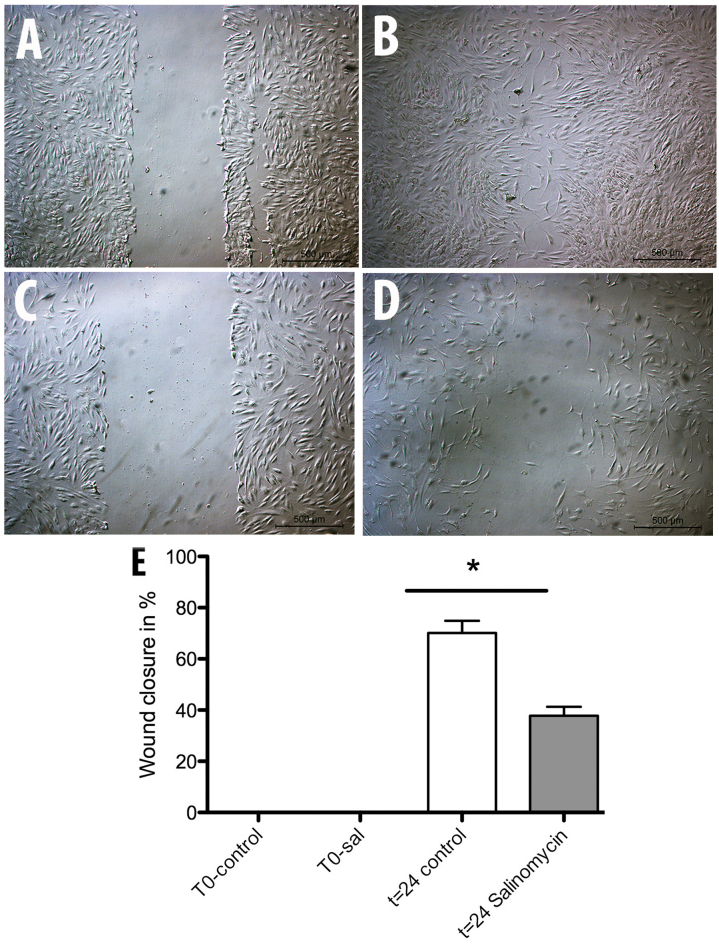
Figure 3.
Analysis of (A and B) MSC-control and (C and D) MSC-Sal migration capability. A wound was generated at time (A and C) t=0 h. After 24 h the areas of wound closure were measured with the program ImageJ. The statistical evaluaton revealed a significant attenuation of migration capability in (E) MSC-Sal. MSC, mesenchymal stem cells. *P<0.05.

