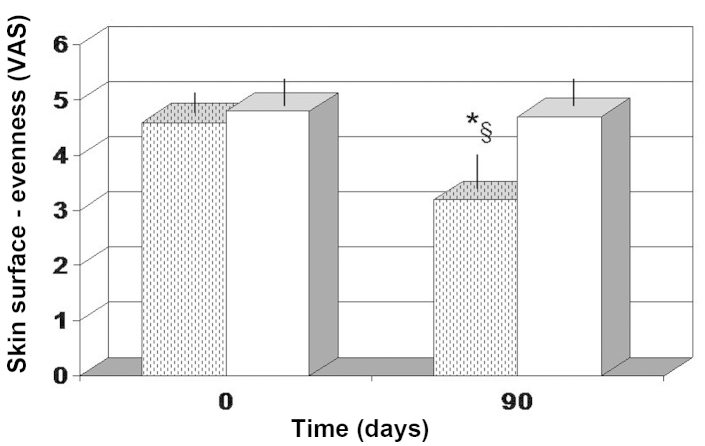
Figure 3.
Skin surface evenness, determined based on the VAS score. The score was interpreted as a perception of unevenness, thus a lower score indicated higher evenness. *P<0.05 vs. baseline and §P<0.05 vs. antioxidant-control. Dotted columns, treated with FPP; white columns, treated with an antioxidant-control; VAS, visual analog scale; FPP, fermented papaya preparation.

