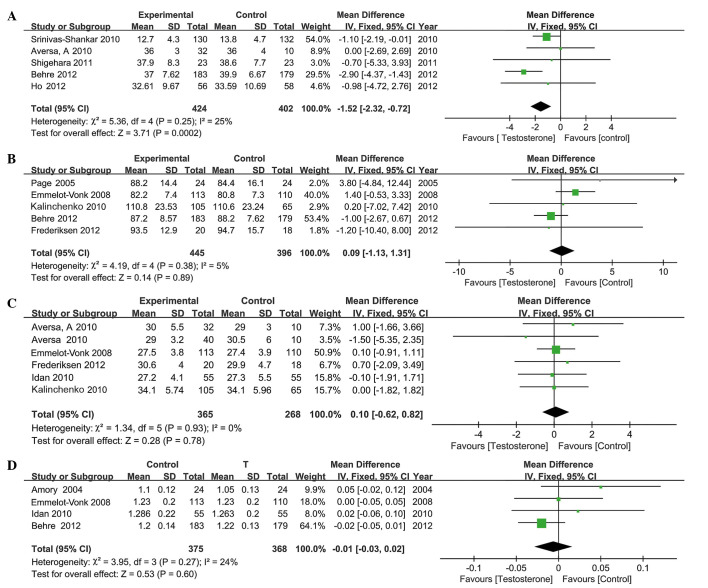
Figure 4.
Forest plots revealing differences in the means of a number of variables. Differences in (A) Aging Male Symptom scores; (B) body weight; (C) body mass index; and (D) bone mineral density between experimental and control groups. SD, standard deviation; CI, confidence interval; df, degrees of freedom.

