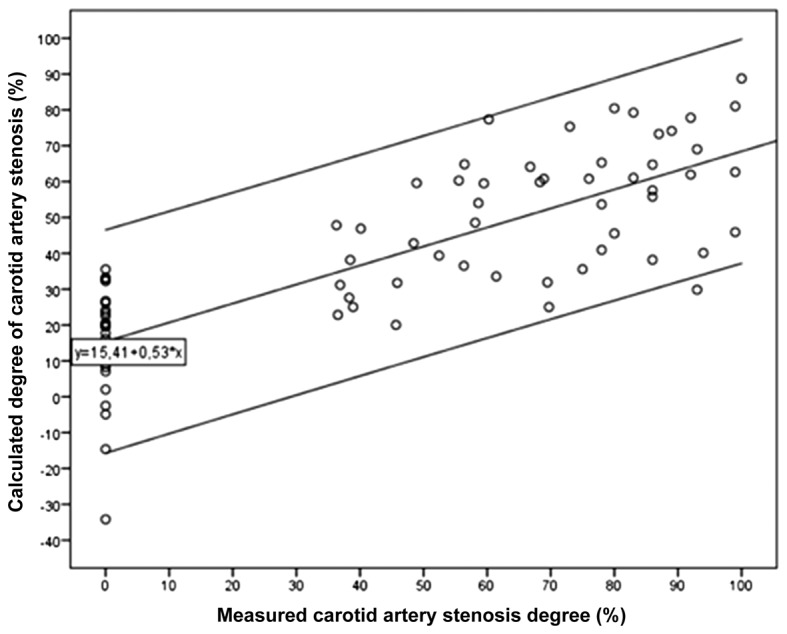
Figure 3.

Comparison of the calculated degree of carotid artery stenosis with the measured degree of carotin artery stenosis. all except one point were located within the 95% confidence interval (upper and lower lines) of the central regression line.
