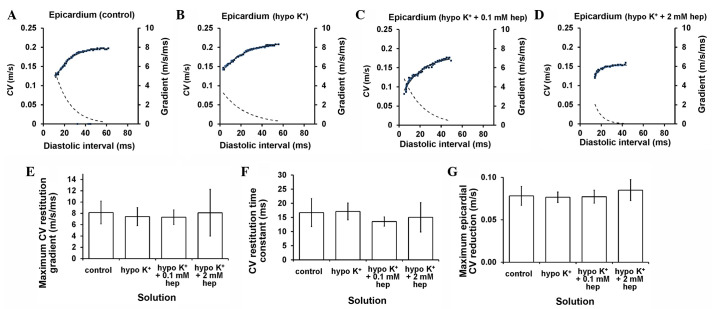
Figure 10.
Restitution curves plotting conduction velocity (CV) against preceding diastolic interval (DI) obtained under (A) control and hypokalaemic conditions (B) prior and subsequent to the introduction of (C) 0.1 or (D) 2 mM heptanol. Curves were fitted with mono-exponential growth functions obtained by least-squares fitting to the values of CV and DI (solid lines, left ordinates). Gradients were obtained by differentiation of the fitted functions (broken lines, right axes). (E) Maximum CV restitution gradients, (F) time constants of restitution curves and (G) maximum CV reductions. None of these parameters was altered by hypokalaemia whether prior or subsequent to the introduction of 0.1 or 2 mM heptanol (P>0.05).

