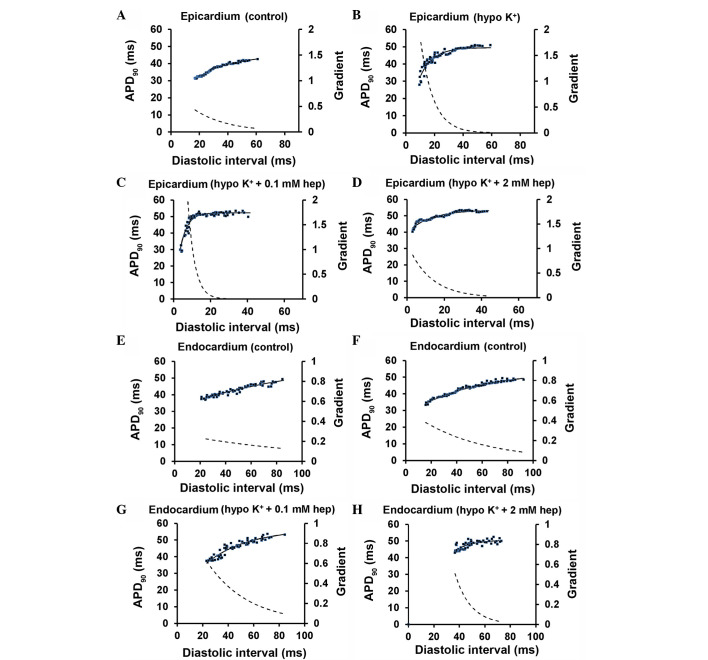
Figure 8.
Restitution curves plotting action potential durations (APD)90 against preceding diastolic interval (DI) obtained from the (A-D) epicardium and (E-H) endocardium under control and hypokalaemic conditions prior and subsequent to the introduction of 0.1 or 2 mM heptanol. Curves were fitted with mono-exponential growth functions obtained by least-squares fitting to the values of APD90 and DI (solid lines, left ordinates). Gradients were obtained by differentiation of the fitted functions (broken lines, right axes).

