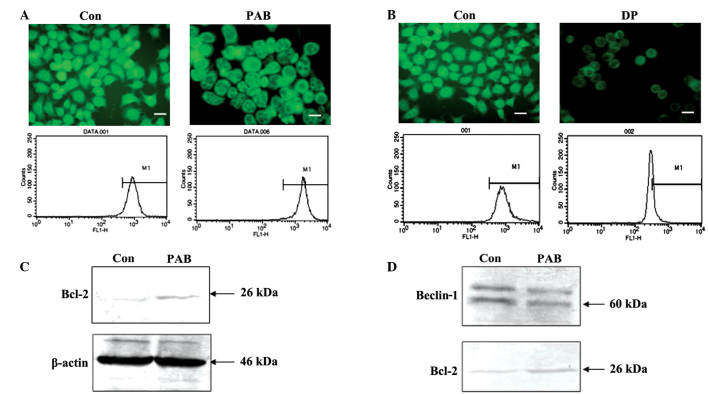
Figure 4.
Mitochondrial profile related to autophagy at 36 h following PAB treatment. (A) Mitochondrial membrane potential was visualized by fluorescence microscopy and detected by flow cytometry with rhodamine 123 staining (scale bar, 25 µm), revealing that PAB did not affect mitochondrial membrane potential compared to the Con group. (B) Mitochondrial membrane potential was visualized by fluorescence microscope and detected by flow cytometry with rhodamine 123 staining after 60 µM DP for 12 h (scale bar, 25 µm); DP decreased the mitochondrial membrane potential compared to the Con group. (C) Expression of Bcl-2 protein was analyzed by western blotting. β-actin was used as a loading control; PAB increased Bcl-2 expression compared to the Con group. (D) Binding of Bcl-2 and Beclin-1 demonstrated by western blotting for Beclin-1 protein expression; PAB decreased the binding of Bcl-2 with Beclin-1 compared to the Con group. Data are representative of three individual experiments (n=3). Con, control; PAB, pseudolaric acid B; DP, dracorhodin perchlorate.

