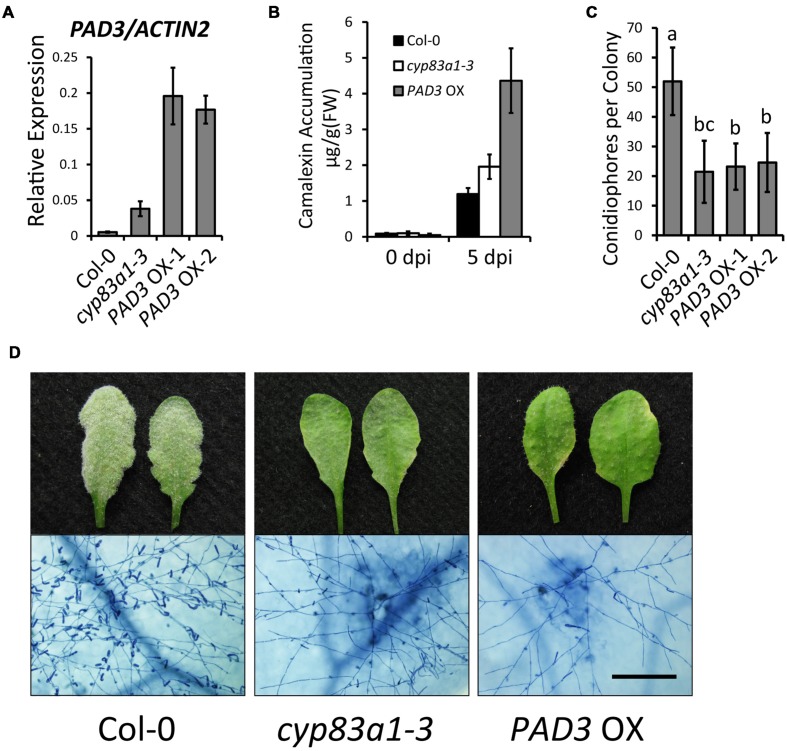
FIGURE 6.
PAD3-overexpressing plants accumulate higher levels of camalexin and display a cyp83a1-3-like resistance phenotype. (A) The accumulation of PAD3 transcript in 4-weeks-old plants was examined by quantitative real-time PCR. Results represent the mean and standard deviation in three independent experiments (n = 4). (B) Four-weeks-old plants were infected with G. cichoracearum and camalexin accumulation was determined at 0 and 5 dpi. Three PAD3-OX independent lines were tested, and similar results were obtained in these lines. One representative PAD3-OX line (PAD3-OX-1) is shown. Results represent the mean and standard deviation in three experiments (n = 3). (C) Quantification of fungal growth of wild-type, cyp83a1-3, and PAD3-OX plants at 5 dpi by counting the number of conidiophores per colony. Results represent the mean and standard deviation in three independent experiments (n = 30). Different letters represent statistically significant differences (P < 0.01, nested ANOVA). (D) Four-weeks-old wild-type, cyp83a1-3, and PAD3-OX-1 plants were infected with G. cichoracearum. Three PAD3-OX independent lines were examined, and similar results were obtained in these three lines. Representative leaves were removed and stained with trypan blue at 8 dpi, bar = 200 μm.

