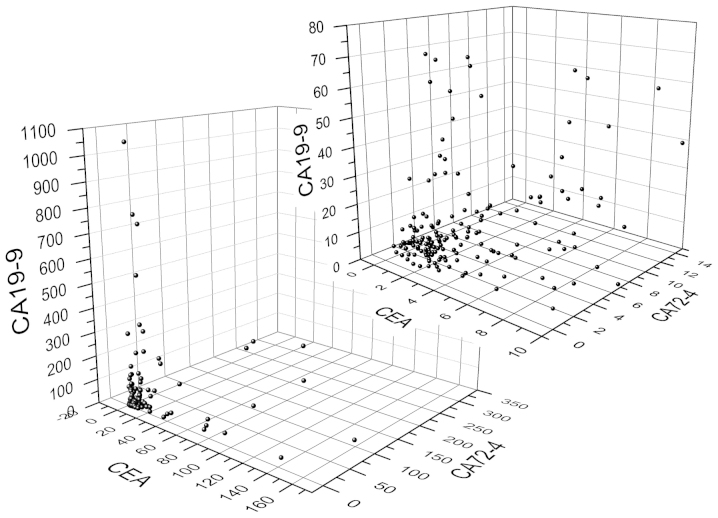
Figure 2.
Three-dimensional scatter plot of the serum levels of CEA, CA19-9 and CA72-4. The left lower graph includes all the data, and the right upper graph includes a portion of the data (CEA, ≤10 ng/ml; CA19-9, ≤80 U/ml; and CA72-4, ≤14 U/ml). CEA, carcinoembryonic antigen; CA19-9, carbohydrate antigen 19-9; CA72-4, carbohydrate antigen 72-4.

