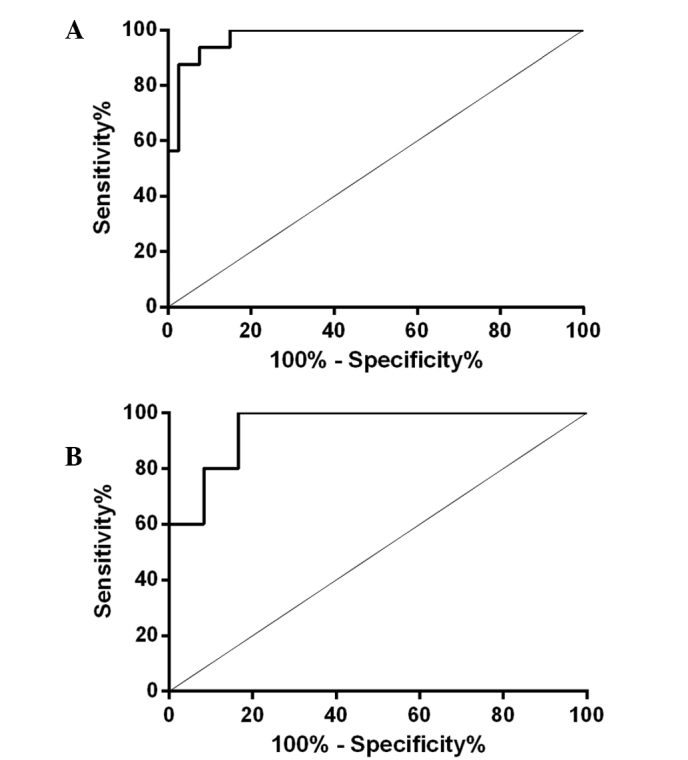
Figure 4.

ROC curve showing the specificity and sensitivity of serum τ protein levels on day 2 after TBI for (A) 1-year poor outcome (GOS-E, 1–4), and (B) 1-year mortality (GOS-E, 1) in the severe TBI group. The AUC of the outcome curve was 0.9781 (95% CI, 0.9472–1.009; P<0.0001), whereas the AUC of the mortality rate curve was 0.9500 (95% CI, 0.8510–1.049; P<0.01). ROC, receiver operating characteristic; TBI, traumatic brain injury; AUC, area under the curve; GOS-E, Extended Glasgow Outcome Scale; CI, confidence interval.
