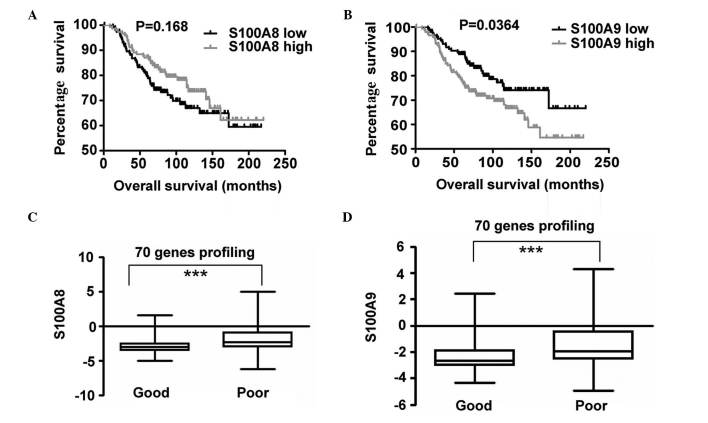
Figure 5.
Analysis of OS of patients with breast cancer based on the expression levels of S100A8 and S100A9, using the Netherlands Cancer Institute dataset. Patients were divided into two groups based on their messenger RNA levels of S100A8/A9. High expression levels of S100A8/A9 in the top 50th percentile represented one group, while low expression levels of S100A8/A9 in the bottom 50th percentile represented the other group. Kaplan-Meier OS curves based on the expression levels of (A) S100A8 and (B) S100A9. Expression levels of (C) S100A8 and (D) S100A9 in poor and good prognosis groups, based on a 70-gene signature profile. The results are presented as the mean ± standard error. OS, overall survival.

