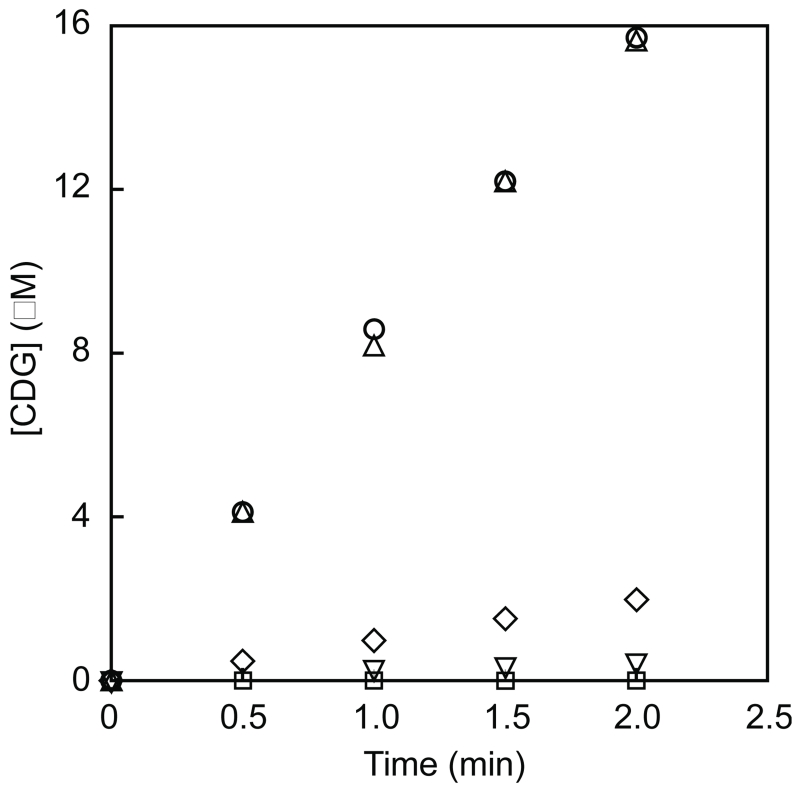
Figure 1.
Time course of BsQueE reaction under various reducing conditions. Activity was monitored by measuring CDG formation. BsQueE activity was measured in the presence 10 mM dithionite (upside-down triangle) or 2 μM Fpr/2 mM NADPH with 5 μM BsYkuN (circle), 5 μM Fpr/2 mM NADPH with 20 μM BsYkuP (triangle), or 5 μM Fpr/2 mM NADPH with 20 μM EcFldA (diamond). Assays where Fpr or NADPH (square) were omitted served as negative controls.

