Figure 3.
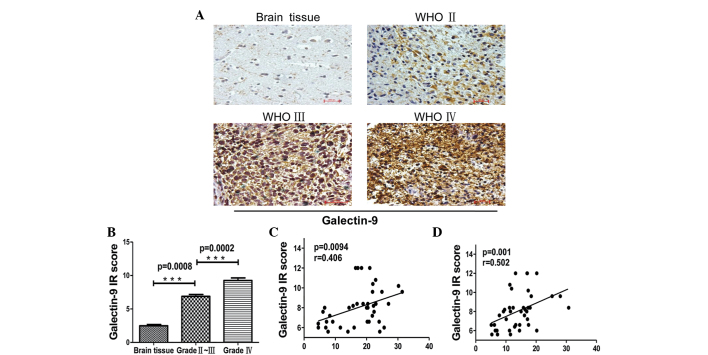
Immunohistochemical staining of glioma tissues for galectin-9 expression. (A) Paraffin-embedded tissue sections from injured brain tissue and different grades of glioma tissues were stained with galectin-9-specific monoclonal antibodies. Representative patterns of galectin-9 expression in brain tissues and different grades of glioma (magnification, ×200). (B) Plot of the scores of galectin-9 expression vs. WHO grade of glioma and IR scores of different grades of glioma (brain tissue, 2.480±0.1855, n=5; glioma grade II–III, 6.880±0.2704, n=20; and glioma grade IV, 9.260±0.3899, n=20). (C and D) Association between galectin-9 in glioma tissues and Tim-3 expression in (C) CD4+ and (D) CD8+ T cells in tumor-infiltrating lymphocytes. P-values were determined by Mann-Whitney U test and Spearman's correlation analysis, ***P<0.001.. Data are expressed as the mean ± standard error of the mean. WHO, World Health Organisation; IR, immunoreactive score; Tim-3, T cell immunoglobulin- and mucin-domain-containing molecule 3; CD, cluster of differentiation.

