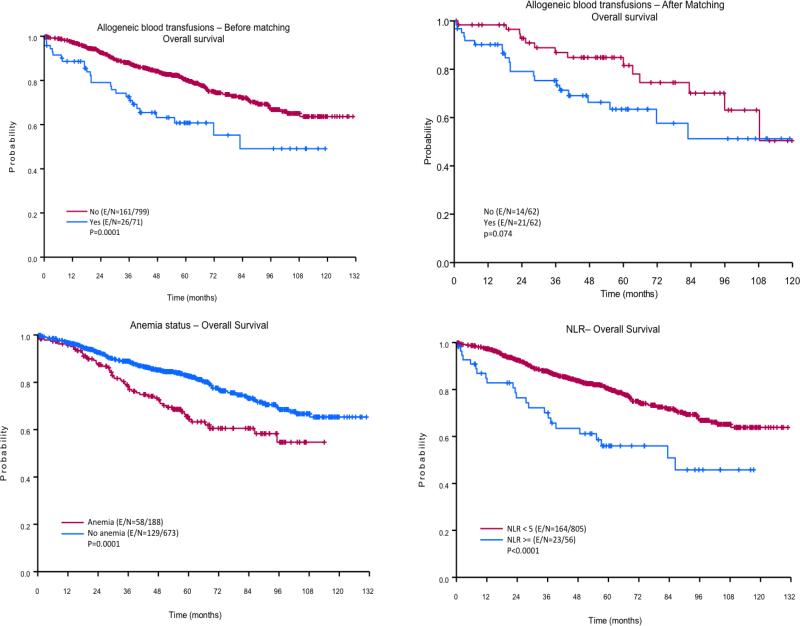
Figure 2. Kaplan-Meier curves for overall survival (OS).
The top panels illustrate the effect of allogeneic blood transfusion (ABT) on OS. The left bottom panel shows the survival curves for patients who did and who did not have preoperative anemia. The right bottom panel depicts the impact of preoperative neutrophil-to-lymphocyte ratio (NLR) on OS.

