
Figure 3.
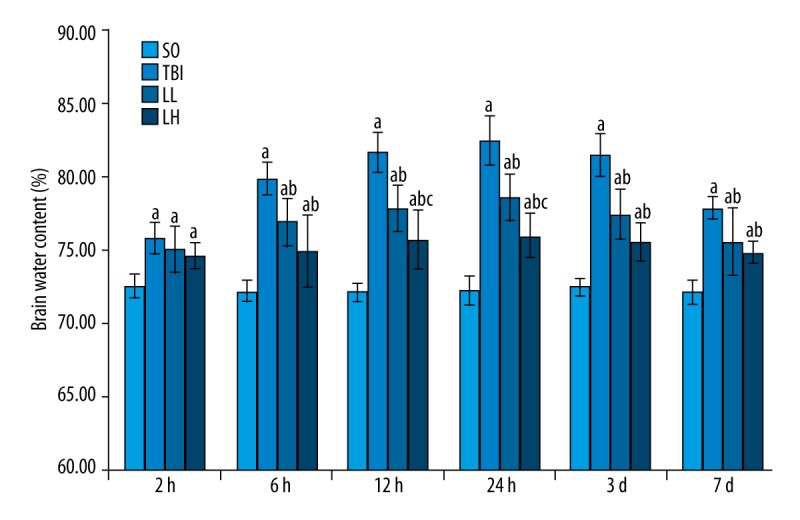
Levetiracetam effects on brain water content in rats with brain edema in each group. Each column represents the mean (%) ±SD. Results were analyzed by 2-way ANOVA followed by Tukey’s post hoc comparisons (each group, n=8). a P<0.05, vs. SO group; b P<0.05, vs. TBI group; c P<0.05, vs. LL group at the same time point.