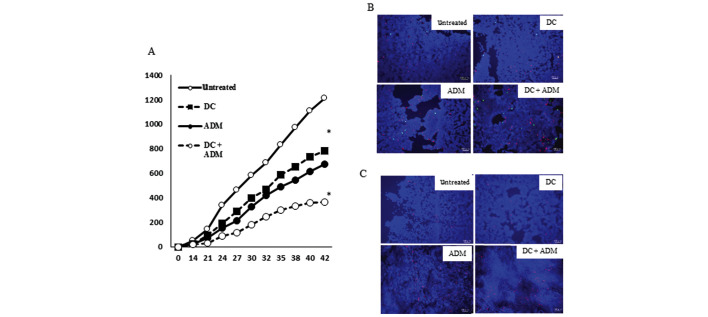
Figure 4.
(A) The tumor volume of the primary lesion in the four treatment groups was evaluated using micro-CT. (B) To evaluate CRT (green) and HSP70 (red) expression in primary lesion, immunofluorescence was performed in the four groups. (C) The positive cells expressing HMGB1 (red) in the four treatment groups are shown. DC, dendritic cell; CRT, calreticulin; ADM, doxorubicin; HSP70, heat shock protein 70; HMGB1, high mobility group box 1. *P<0.05 vs. untreated.

