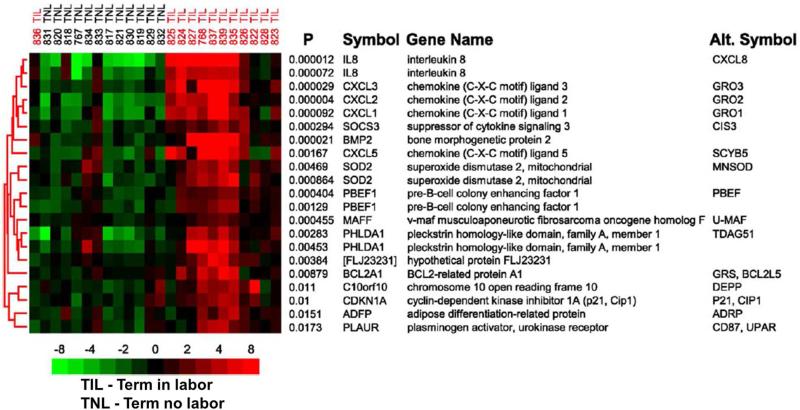
Figure 2.
The subcluster of genes with the smallest discriminant P values included many genes known to be involved in the inflammatory response. Row labels correspond to the permuted t test P value followed by the HUGO Gene Nomenclature Committee (HGNC) official gene symbol, and include the most commonly used alternative gene symbol. Gene expression levels were median-centered and pseudocolored such that red indicates an increased, green indicates a decreased, and black represents the median expression levels, as indicated by the color bar whose numbers indicate fold change. Labels at the top indicate individual patient samples and their clinical designation. Modified from Figure 2 Haddad R, Tromp G, Kuivaniemi H, Chaiworapongsa T, Kim YM, Mazor M, Romero R., Am J Obstet Gynecol. 2006 Aug;195(2):394.e1-24.

