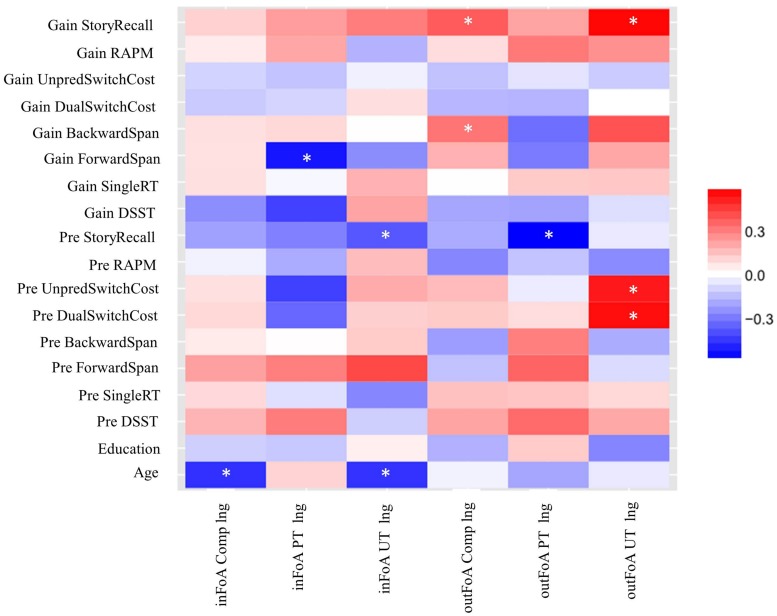
FIGURE 7.
A heat map representing correlation (rho) between the transfer tasks (both initial performances as well as training-based performance gains) and learning rates (the two training tasks for PT and UT separately and the comparison task for all participants). An asterisk (∗) indicates a significant correlation.

