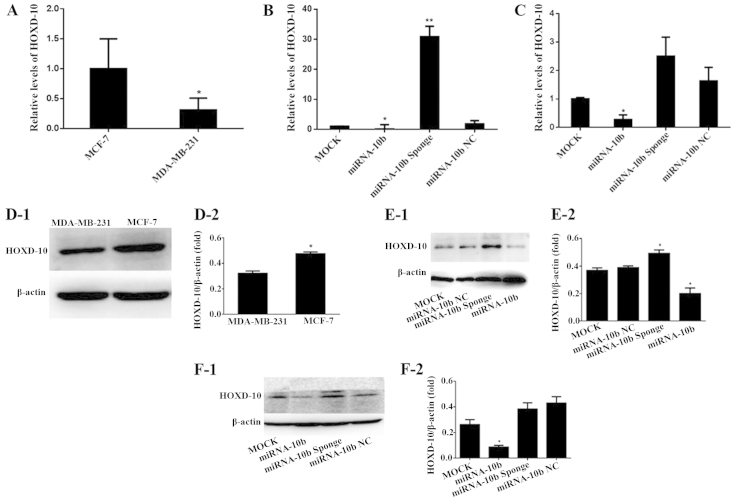
Figure 2.
mRNA and protein expression levels of HOX-10 in the MDA-MB-231 and MCF-7 cells. (A) The mRNA expression of HOXD-10 mRNA in the MDA-MB-231 and MCF-7 cells, *P<0.05 vs. MCF-7. (B) The mRNA expression of HOXD-10 after transient transfection with miRNA-10b and the miRNA-10b sponge in the MDA-MB-231 cells, *P<0.05 vs. miRNA-10b NC; **P<0.01 vs. miRNA-10b NC. (C) The mRNA expression of HOXD-10 after transient transfection with miRNA-10b and the miRNA-10b sponge in the MCF-7 cells, *P<0.05 vs. miRNA-10b NC. (D) The protein expression of HOXD-10 in the MDA-MB-231 and MCF-7 cells: (D-1) HOXD-10 protein electrophoresis map; (D-2) histogram of the gray values of the relative HOXD-10 protein expression levels, *P<0.05 vs. MDA-MB-231. (E) The protein expression of HOXD-10 after transient transfection with miRNA-10b and the miRNA-10b sponge in the MDA-MB-231 cells: (E-1) HOXD-10 protein electrophoresis map; (E-2) histogram of the gray values of the relative HOXD-10 protein expression levels, *P<0.05 vs. miRNA-10b NC. (F) The protein expression of HOXD-10 after transient transfection with miRNA-10b and the miRNA-10b sponge in the MCF-7 cells: (F-1) HOXD-10 protein electrophoresis map; (F-2) histogram of the gray values of the relative HOXD-10 protein expression levels, *P<0.05 vs. miRNA-10b NC.

