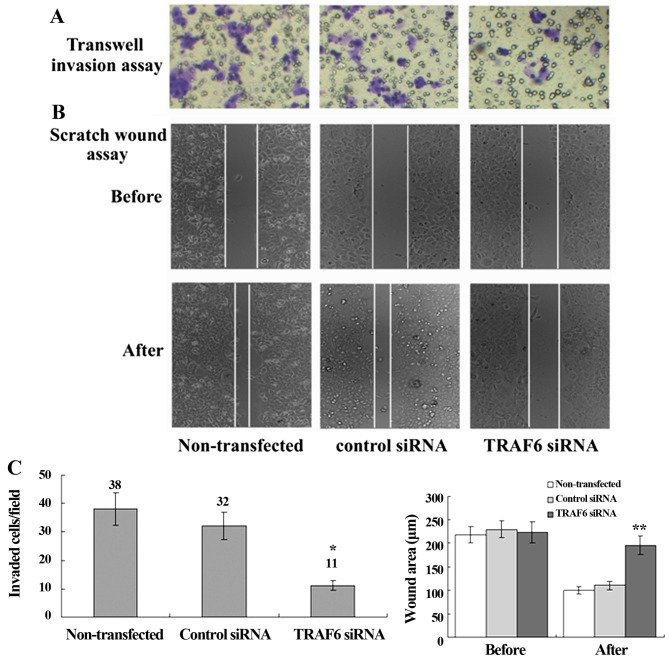
Figure 5.
Effect of TRAF6 knockdown on SPC-A1 cell invasion. Light microscopy images are shown immediately after scratching of the monolayer and 48 h later. Cells moved more slowly over the wound after TRAF6 knockdown. The crystal violet staining indicates the SPC-A-1 cells that passed through the polycarbonate membrane. (A) Transwell invasion assay; (B) scratch wound assay; (C) number of invaded/migrated cells without transfecion, transfected with control siRNA and TRAF6 siRNA. *P<0.05 vs. control siRNA; **P<0.01 vs. control siRNA.

