
Figure-1.
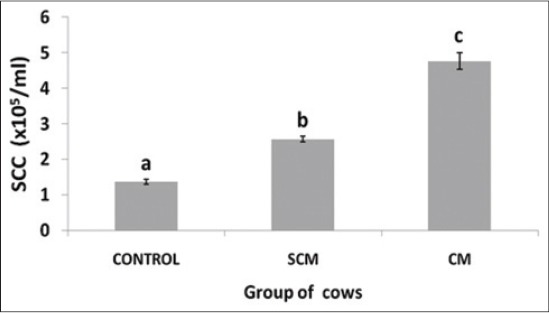
Somatic cell counts (× 105)/ml of milk in different groups of Karan Fries cows. Significance of the difference among the three groups is indicated with asterisks (*p<0.05; n=12). Bars represent the standard error of the mean
Official websites use .gov
A
.gov website belongs to an official
government organization in the United States.
Secure .gov websites use HTTPS
A lock (
) or https:// means you've safely
connected to the .gov website. Share sensitive
information only on official, secure websites.
Somatic cell counts (× 105)/ml of milk in different groups of Karan Fries cows. Significance of the difference among the three groups is indicated with asterisks (*p<0.05; n=12). Bars represent the standard error of the mean