
Figure-5.
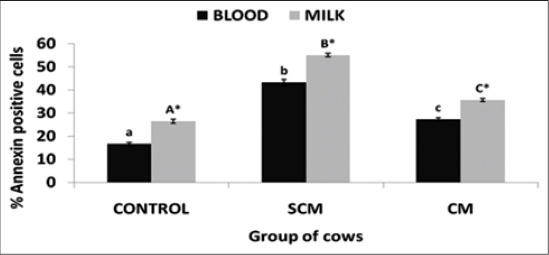
Per cent annexin positive neutrophils of different groups of Karan Fries cows. Significance of the difference among the three groups is indicated with asterisks (p<0.05; n=12). Bars represent the standard error of the mean
Official websites use .gov
A
.gov website belongs to an official
government organization in the United States.
Secure .gov websites use HTTPS
A lock (
) or https:// means you've safely
connected to the .gov website. Share sensitive
information only on official, secure websites.
Per cent annexin positive neutrophils of different groups of Karan Fries cows. Significance of the difference among the three groups is indicated with asterisks (p<0.05; n=12). Bars represent the standard error of the mean