
Figure 4.
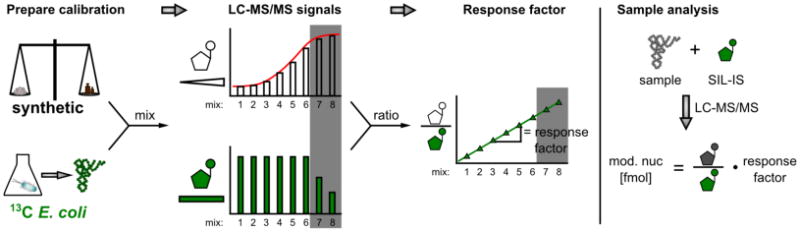
Calibration measurements to determine the mass spectrometric response factor for a ribonucleoside in absolute quantification approaches. The synthetically available and biosynthetically produced SIL-IS are mixed in different ratios (SIL-IS concentration is kept constant). The calibration mixes are then measured and the signals plotted. The increasing amounts of the unlabeled ribonucleoside results in a sigmoid signal plot. The gray area indicates reduced signals due to saturation effects. The signal ratios of unlabeled and labeled analyte are plotted and the slope determined. The slope represents the response factor of the analyte. Note the extended dynamic range in the gray area (saturation range). Adapted and modified from (Gu, Begley, & Dedon, 2014; Kellner, Ochel, et al., 2014; Su et al., 2014)