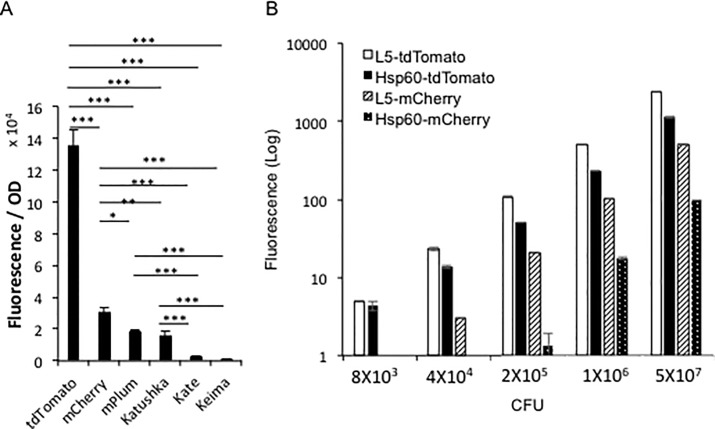
Fig 1. In vitro comparison of the brightness among different fluorescent protein-expressing mycobacterial strains.
A. Comparison of the brightness among different fluorescent protein expressing mycobacterial strains in culture medium. Different fluorescent protein expressing M. bovis BCG strains were cultured in MOAD medium to OD600 0.5~1, and then the fluorescent signal of them were detected with a multimode reader at the optimal wavelength condition for each FP. For each FP expressing strain, fluorescence signal was calculated by subtracting the background fluorescence of the strain carrying the backbone vector for the FP. The Y-axis value was calculated mean of fluorescence of triplicates divided by their OD at 600 nm. The error bars are standard deviations. One-way ANOVA test was conducted for assessing overall differences among groups, and Turkey’s multiple comparison tests were applied to assess differences between two groups. * P<0.05; ** P<0.01; and *** P<0.001. B. Comparison of the brightness among M. bovis BCG-L5-tdTomato, M. bovis BCG-Hsp60-tdTomato, M. bovis BCG-L5-mCherry, and M. bovis BCG-Hsp60-mCherry. Five concentrations for each strain of bacteria were loaded into a 96-well plate. The fluorescence of samples were compared by a multimode reader with 530 nm excitation and 590 nm emission wavelengths for tdTomato; 570 nm excitation and 620 nm emission wavelengths for mCherry. Y-axis is in log scale. Data represent one of at least three independent replicate experiments. The error bars are standard deviations.

