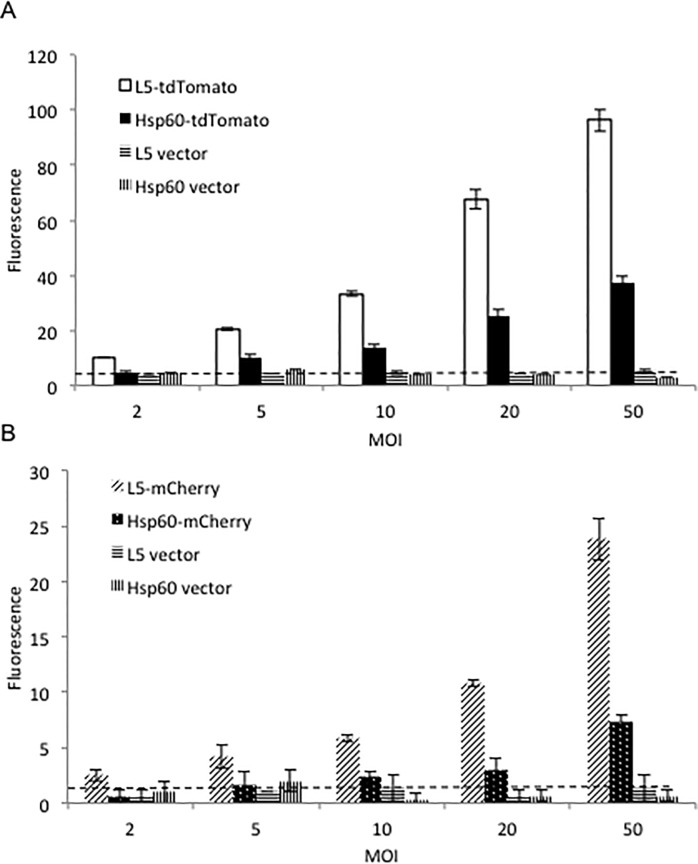
Fig 2. Comparison of strains expressing fluorescent proteins under L5 and Hsp60 promoter expression in infected cells.
J774A.1 cells were infected with various multiplicities of infection (MOI) of the BCG strains expressing L5-tdTomato or Hsp60-tdTomato (A); L5-mCherry or Hsp60-mCherry (B). Fluorescence was measured with a multimode reader with excitation wavelength 530 nm and emission wavelength 590 nm for tdTomato and excitation wavelength 570 nm and emission wavelength 620 nm for mCherry. Value in Y-axis represents mean of fluorescence of triplicates divided by their OD at 600 nm. The error bars are standard deviations. Dotted lines represent background fluorescence from strains carrying backbone vectors. Data represent one of at least three independent replicate experiments.

