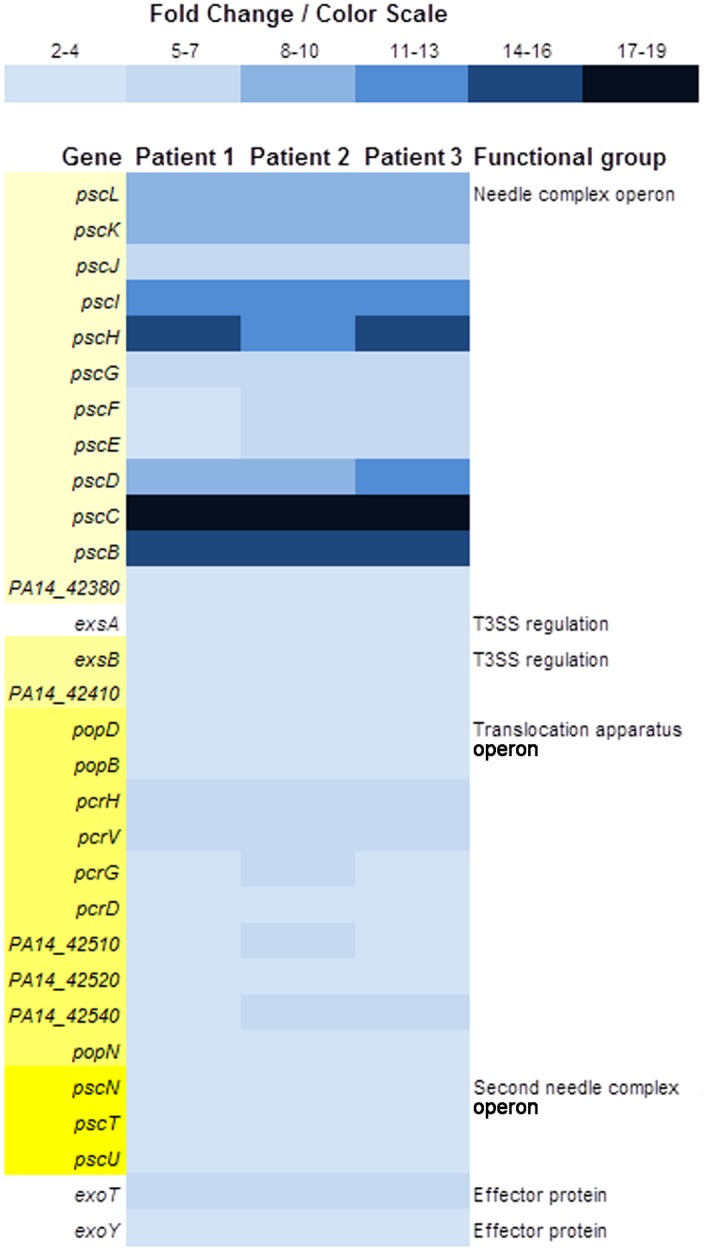
Fig 4. Color scale map of the T3SS genes that are either upregulated.

Expression of genes in PA14 grown in whole blood from the three severely burned patients was compared with expression of these genes when PA14 was grown in whole blood from the a healthy volunteer. Upregulated genes are indicated in shades of blue. Genes within operons, whether all genes of the operon are differentially expressed or not, are indicated in shades of yellow on the left. Single genes are not shaded. Operon groupings and functions for PA14 genes were obtained from the MGH-ParaBioSys:NHLBI Program for Genomic Applications, Massachusetts General Hospital and Harvard Medical School, Boston, MA (http://pga.mgh.harvard.edu; accessed 10Nov2015) [45] made available by the Pseudomonas Genome Database (http://www.pseudomonas.com/; accessed 10Nov2015) [44].
