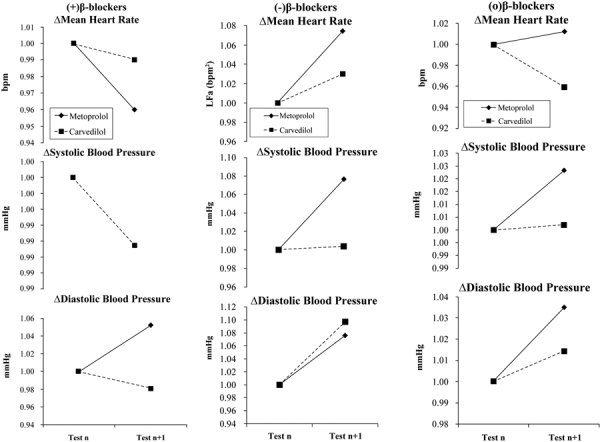
Fig. 1 -.

Hemodynamic responses to beta-blocker therapy at baseline and at follow-up. Therapy was changed as indicated after baseline testing. a) The naïve patient responses to the introduction of beta-blocker. b) Patients on stable beta-blocker therapy, which is then discontinued. c) Patients on stable beta-blocker therapy, which is then continued. (a) and (b) represent the experimental groups (1 and 2, respectively) and (c) represents the control group. (Please see text for details.)
