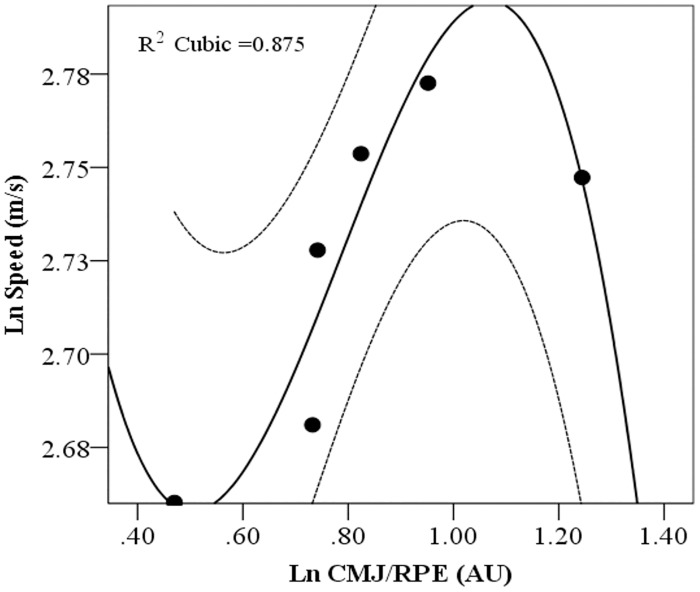
Fig 4. CMJ/RPE index vs. Speed.
Values are the natural logarithm of the mean for each split. The data was modeled with a 3rd order polynomial (y = -1.5165x3 + 3.5764x2–2.4485x + 3.1776; r2 = 0.875). The order of splits is reversed due to the logarithmic transformation; therefore the first split is the one on the farthest right.

