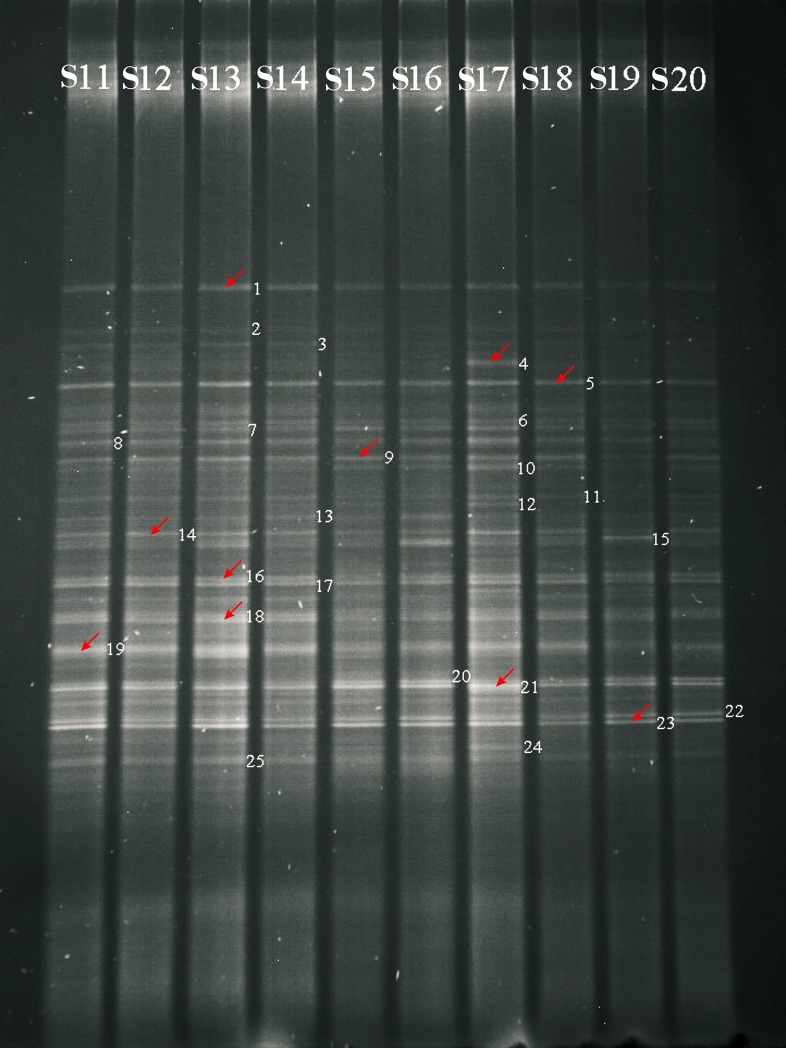
Fig 2. DGGE analysis of bacterial community profiles of 16S rDNA PCR amplification products of rhizosphere soil samples S11-S20 in sole-cropping experiment.
Soil samples were labeled as Table 2. S11, Hulled oat, S12, Mung bean, S13, Foxtail millet, S14, Barley, S15, Rape, S16, Sunflower, S17, Carrot, S18, Flax, S19, Naked oat, S20, Tobacco. Arrows indicate the selected bands occurring either in all soils or in some soils only. The numbers without arrows show the visible bands under UVI Bioimaging system without further DNA sequencing.

