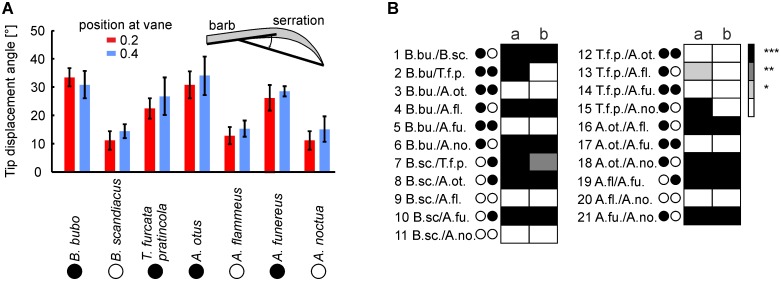
Fig 11. Tip displacement angles.
(A) Plotted are the mean values and standard deviations of these 25 measurements. The inset in (A) shows how the displacement angle was measured. The color of the bars depicts the position at the feather. (B) Statistical comparison. The data base is the same as in Fig 10, and the measurement results for the tip displacement angle of all investigated owl species were compared in the same way as the inclination angles (see legend to Fig 10). Note that similar to the data for the inclination angle, in 20 out of 24 comparisons, more than 99% of the runs were different.

