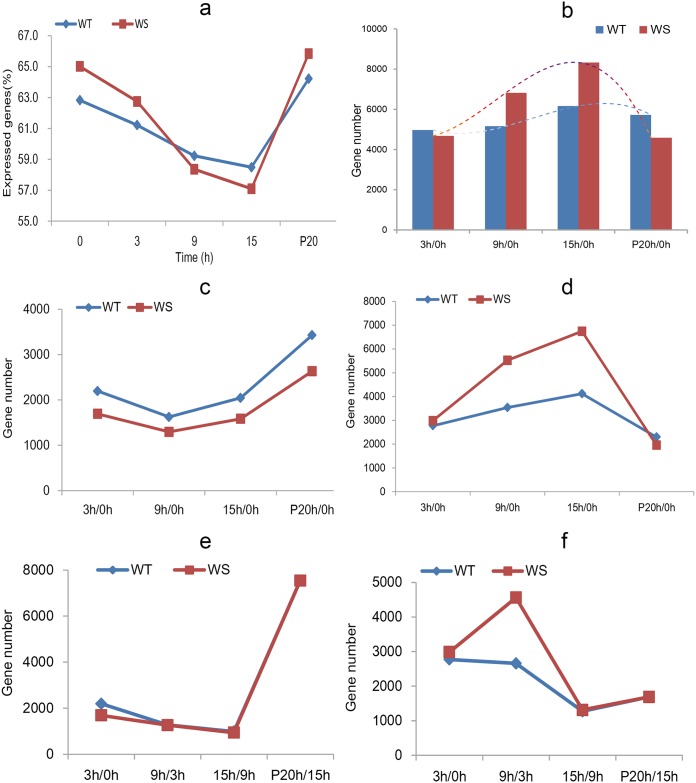
Fig 2. Changes in gene expression in WT and WS plants.
(a) Percentages of the expressed genes during waterlogging from 0 to 15 h as well as 20 h post drainage. (b) The number of genes significantly affected by the stress. (c) Upregulated genes using 0 h as a control. (d) Downregulated genes using 0 h as a control. (e) Upregulated genes using the former sampling point as a control, illustrating the dynamic changes in differentially expressed genes (DEGs) in sesame upon waterlogging exposure. (f) Downregulated genes using the former sampling point as a control.

