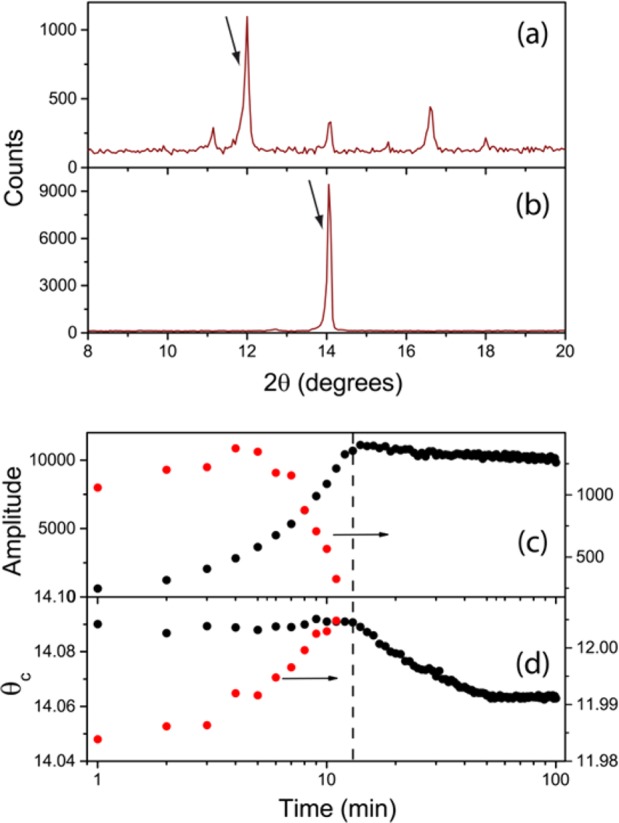
Figure 1.

XRD data of thin-film perovskites collected at two points of the annealing process: 1 (a) and 100 min (b) after precursor deposition. Diffraction peaks associated with CH3NH3PbI3 and PbI2-related precursors are indicated with arrows. Evolution of the intensity maximum of the XRD peak (c) corresponding to CH3NH3PbI3 (black) and precursor species (red circles) and angular position (d) as a function of anneal time.
