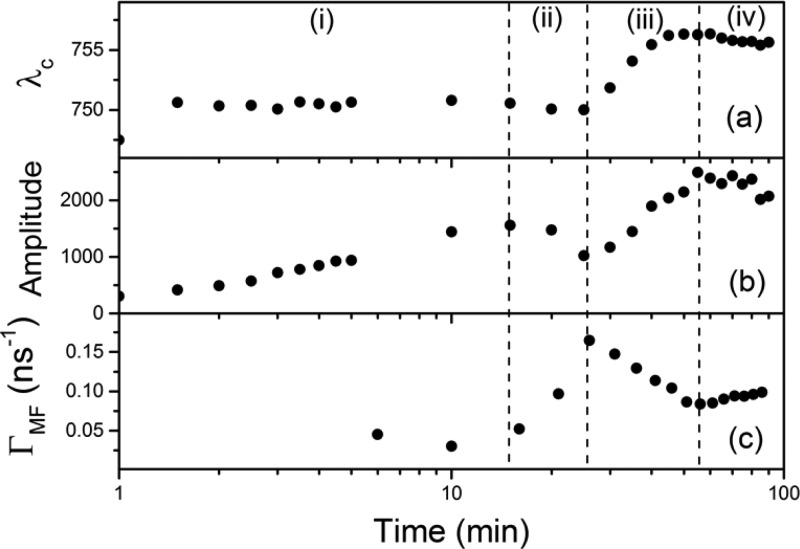
Figure 2.
Time evolution during the annealing process of spectral position (a) and amplitude (b) of the PL peak and most frequent value of the decay rate distribution (c). Four regimes corresponding to four different perovskite film formation stages (see text) are separated by vertical dashed lines.

