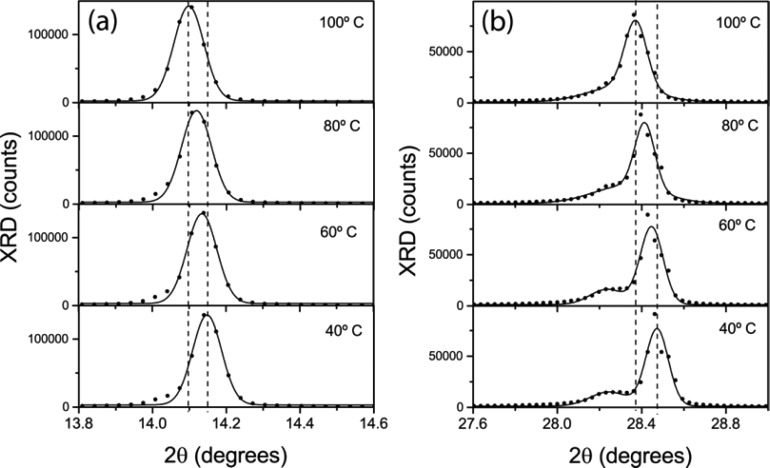
Figure 4.
XRD data collected as a CH3NH3PbI3 film was gradually cooled from 100 (i.e., the annealing temperature) to 40 °C. Graphs (a) and (b) correspond to angular ranges where characteristic diffraction peaks are expected for the cubic and tetragonal phases of the perovskite material. Full circles correspond to experimental data and lines are fits to a Gaussian line shape. Vertical lines highlight the angular position of the main diffraction peaks at the start and end temperatures.

