
Fig 7. Expression analysis of genes associated with both flowering time and yield.
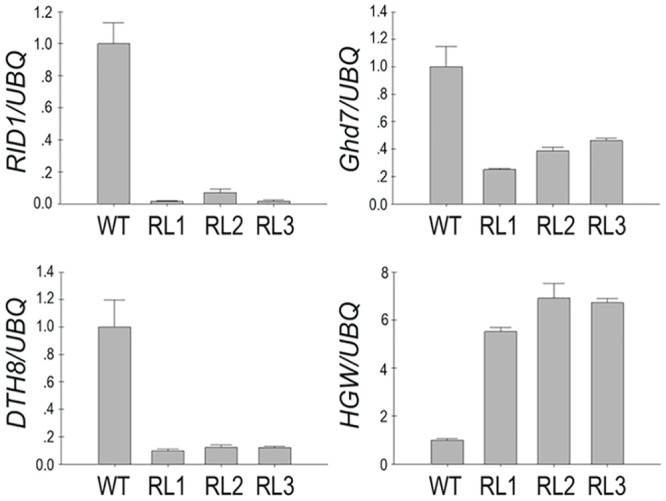
Expression of DTH8, RID1, HGW and Ghd7was measured using quantitative RT-PCR. These experiments were repeated at least three times. Ubiquitin was used as an internal control. Error bars represent ± SD.