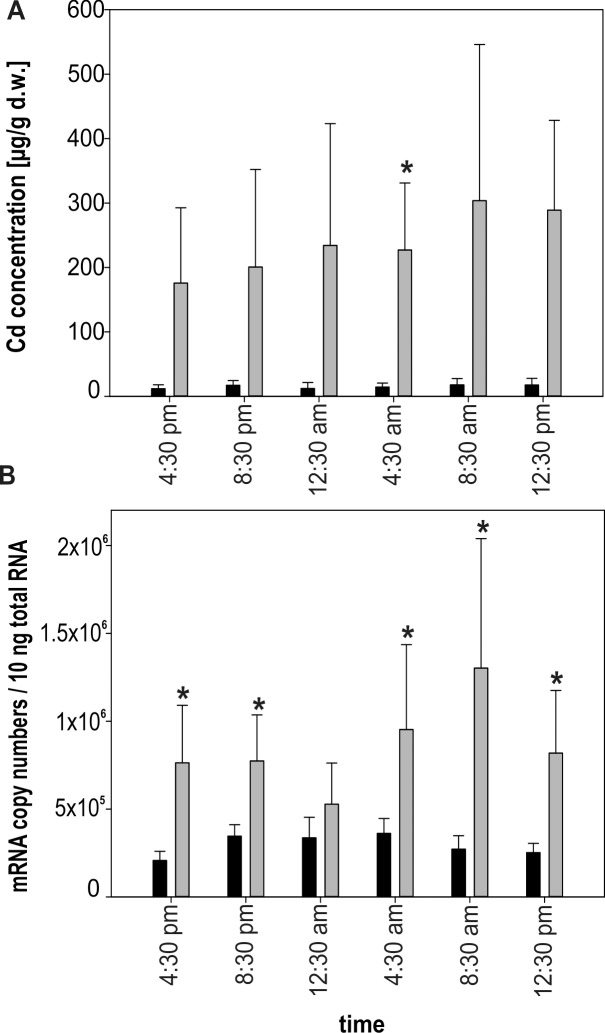
Fig 4. Upregulation of CdMT gene transcription due to Cd exposure in the Roman snail.
(A) Bar graph of Cd concentrations (μg / g d.w.) of controls (black bars; n = 4–5) and Cd-exposed snails (grey bars; n = 3–5), including non-feeders, during the diurnal cycle. (B) Bar graph with means and standard deviation (+SD) of CdMT mRNA concentrations from controls (black bars; n = 5) and Cd-exposed snails excluding non-feeders (grey bars; n = 3–5) measured at six different time points of the diurnal cycle. Significant differences (P = <0.0083) between control and Cd-exposed individuals are indicated by an asterisk (multiple comparisons).

