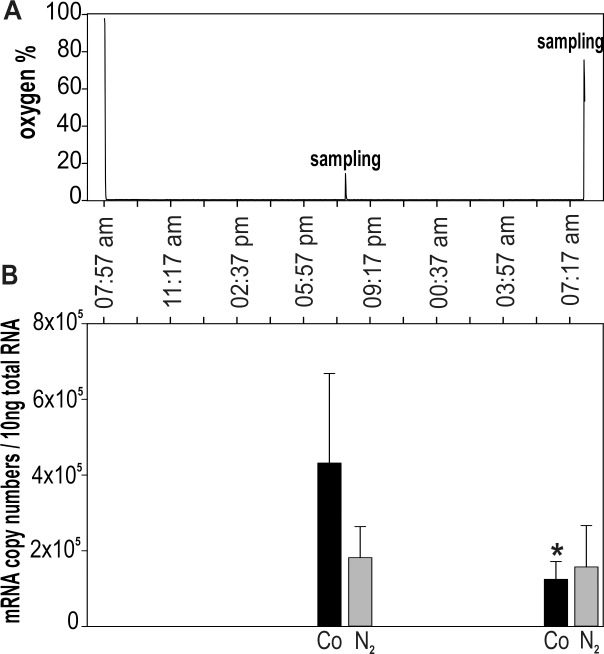
Fig 6. mRNA quantification of Helix pomatia CdMT gene transcription after exposure to oxygen depletion through 24 hours.
(A) Plot of average oxygen concentration (%) in the atmosphere of the exposure chamber throughout the whole experiment, showing one oxygen peak due to sampling at 08:00 pm, when the oxygen level in the chamber rose up to 14% and decreased within 5 minutes under less than 1%. (B) Bar plot showing means and standard deviations (+SD) of CdMT mRNA copy numbers (n = 4–5) in control snails (black bars) and snails exposed to oxygen depletion (grey bars) after 12 (08:00 pm) and 24 (08:00 am) hours. The asterisk indicates a significant difference (P>0.031; Two Way ANOVA) between control snails after 12 hours and 24 hours exposure. Abbreviations: Co = control snails; N2 = snails exposed to oxygen depletion.

