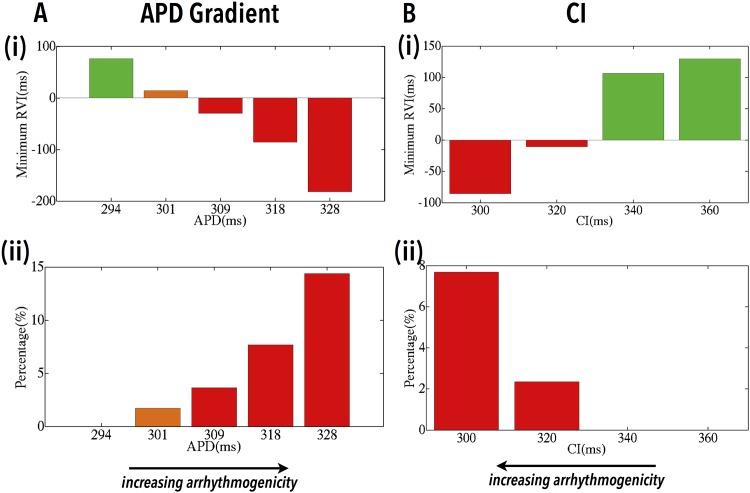
Fig 5. Dependence of RVI on the arrhythmogenic potential of the substrate.
Variations in RV Imin (i) and RV I%<50 (ii) as a function of the APD of the distal region (A) and the S1S2 CI (B). Bars are colour-coded as induced UDB/reentry (red), BDB/failed reentry (orange) and no block/propagation (green).

