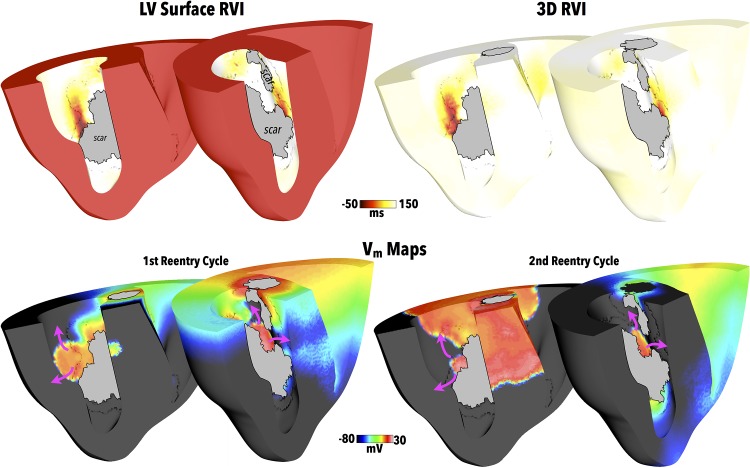
Fig 7. RVI following apical pacing with LAD scar.
Upper panels show RVI values computed on LV endocardial surface (left) and on all 3D myocardium (right) for the LAD scar following apical pacing with clipping planes used in 2 views to facilitate visualisation of endocardial surfaces. Greyed regions signify necrotic scar on endocardial surface. Snap-shots of Vm distributions during the first two cycles of reentry are shown in the lower panels, highlighting exit sites of induced reentry with purple arrows used to show reentrant activation paths.

