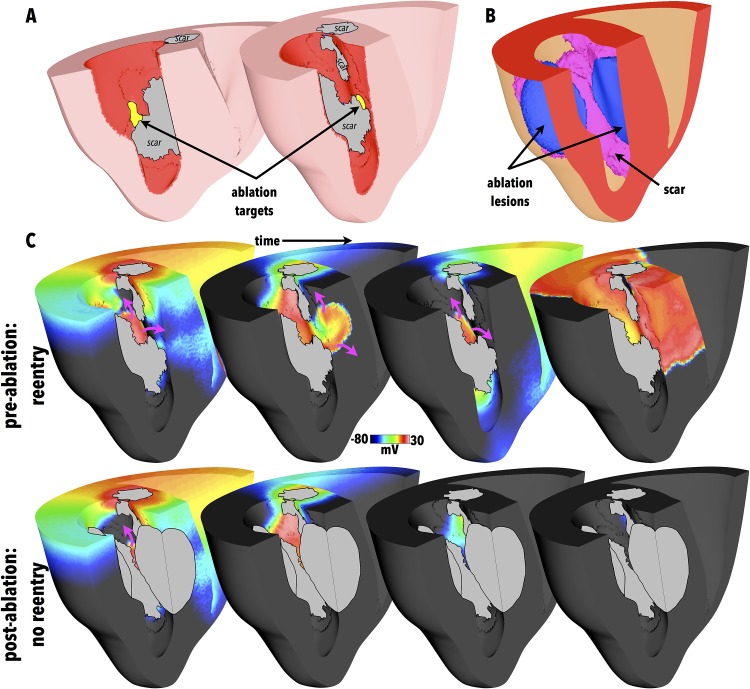
Fig 8.
(A) Target ablation locations identified as regions with LV surface RVI < 25 ms, highlighted in yellow, with clipping planes used in 2 views to facilitate visualisation of endocardial surfaces. Greyed regions signify necrotic scar on endocardial surface. (B) Visualisation of corresponding ablation lesion (blue) in addition to scar (purple). Opaque surfaces used to facilitate intramural visualisation. (C) Comparison between activation dynamics pre- (top) and post- (bottom) ablation showing snap-shots of Vm distributions. Purple arrows show wavefront propagation directions. Greyed regions signify necrotic scar as well as lesion.

