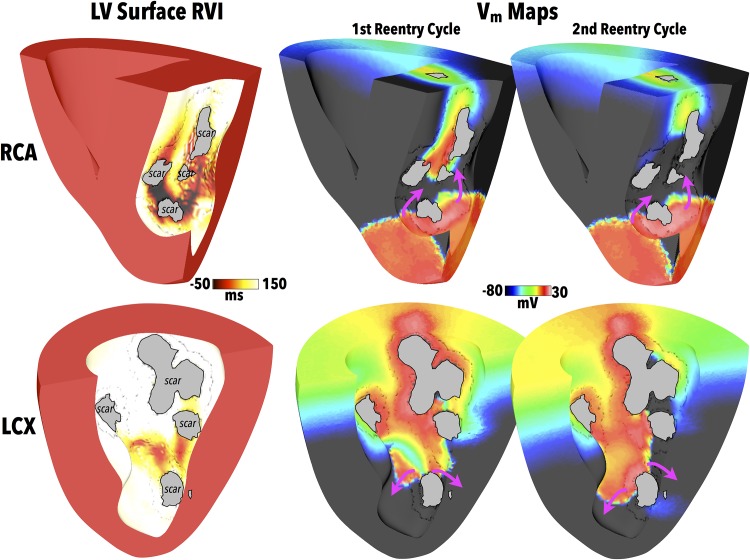
Fig 9. RVI within different scar anatomies.
RVI computed on LV endocardial surface (left) for both the RCA and LCX scar models, along with snap-shots of Vm distributions (right) showing exit sites of induced reentries during the first two reentry cycles. Purple arrows show wavefront propagation directions. Greyed regions signify necrotic scar on endocardial surface.

