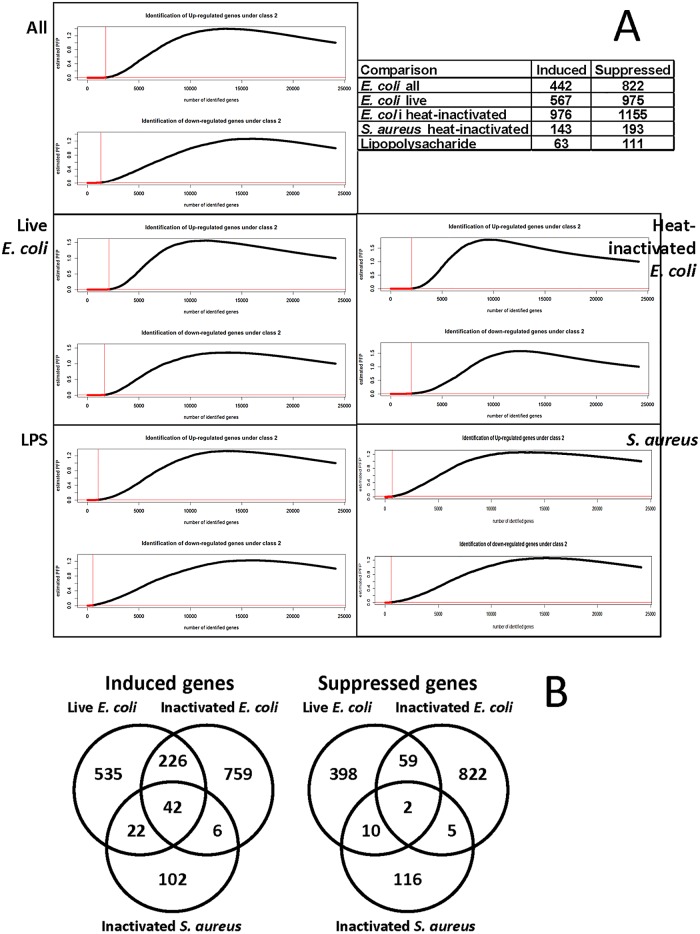
Fig 1. Selection of regulated genes using nonparametric RankProd evaluation.
A) The genes differentially expressed with a p-value better than 0.01 are marked with dashed line. The table inset shows the numbers of regulated genes used in analysis, selected with a 10−4 cut-off, except for the LPS treatment, where we used 10−3 cut-off because a single study provided statistically less significant values. B) Venn diagrams of overlaps among the selected genes. Note that the more extensive overlaps between the E. coli regulated genes may be due to the larger numbers of such genes, when compared to the list of genes regulated by S. aureus. For studies used in this figure please refer to Table 1.

