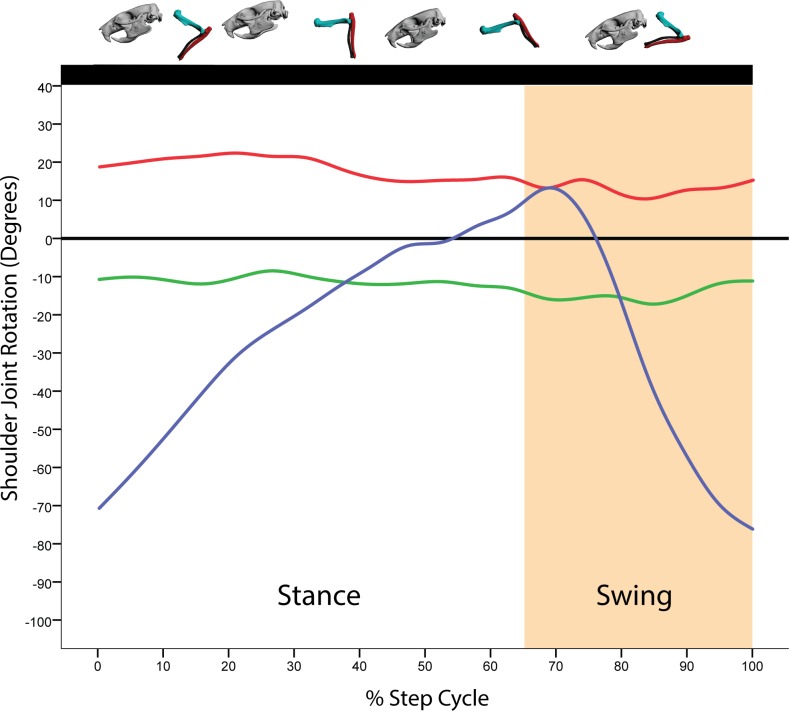
Fig 5. Average motion in degrees at the shoulder joint coordinate system (JCS) for a R. norvegicus step cycle.
Above the graph is a representation of the forelimb posture relative to the step cycle. Here, all ten trials from all three rats were binned for every 5% of the step cycle. Blue = Z-axis (protraction/retraction); Green = Y-axis (abduction/adduction); X-axis (long-axis rotation).

